Tuesday Poster Session
Category: Colon

Islam Rajab, MD
St. Joseph's University Medical Center
Paterson, NJ
Colorectal cancer (CRC) is a leading cause of death in adults ≥ 45 years and often coexists with iron‐deficiency anemia (IDA), yet national mortality trends for patients with both conditions are poorly characterized.
We analyzed CDC WONDER data (1999–2020) on CRC deaths with IDA (ICD-10 C18.0–C18.9; D50.x), calculating age-adjusted mortality rates (AAMRs) per 100,000 for adults ≥ 45 by year, sex, race/Hispanic origin, age group (45–54, 55–64, 65–74, 75–84, ≥ 85), 2013 NCHS urbanization level, and place of death (counts < 20 suppressed), and described temporal and subgroup trends.
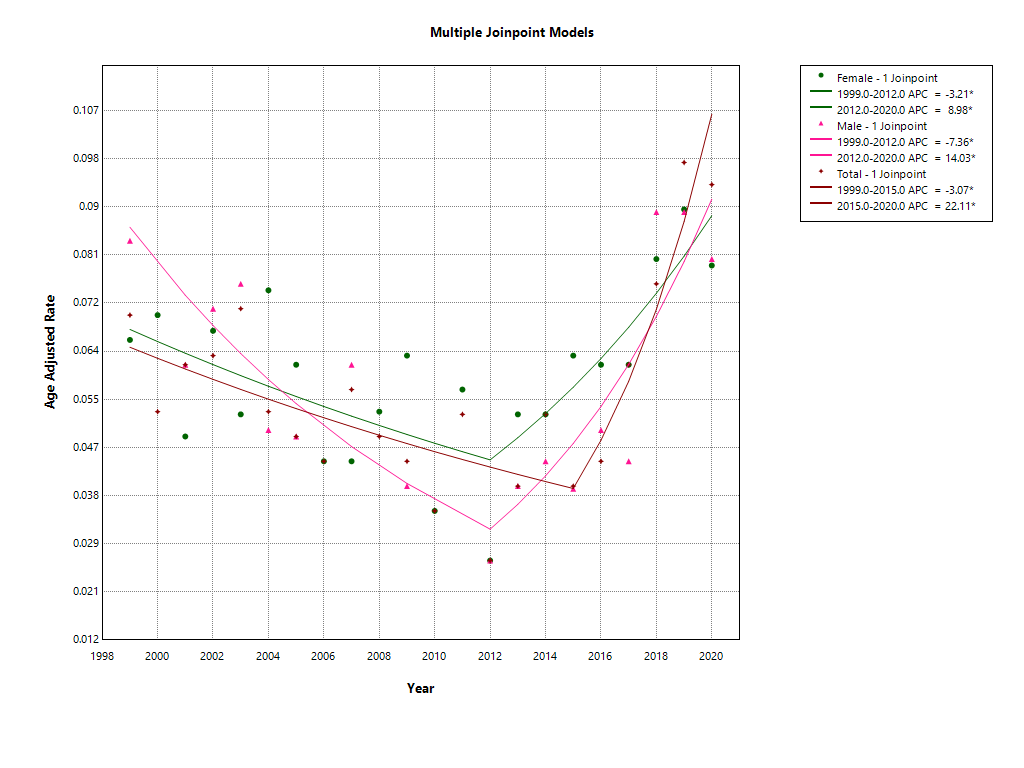
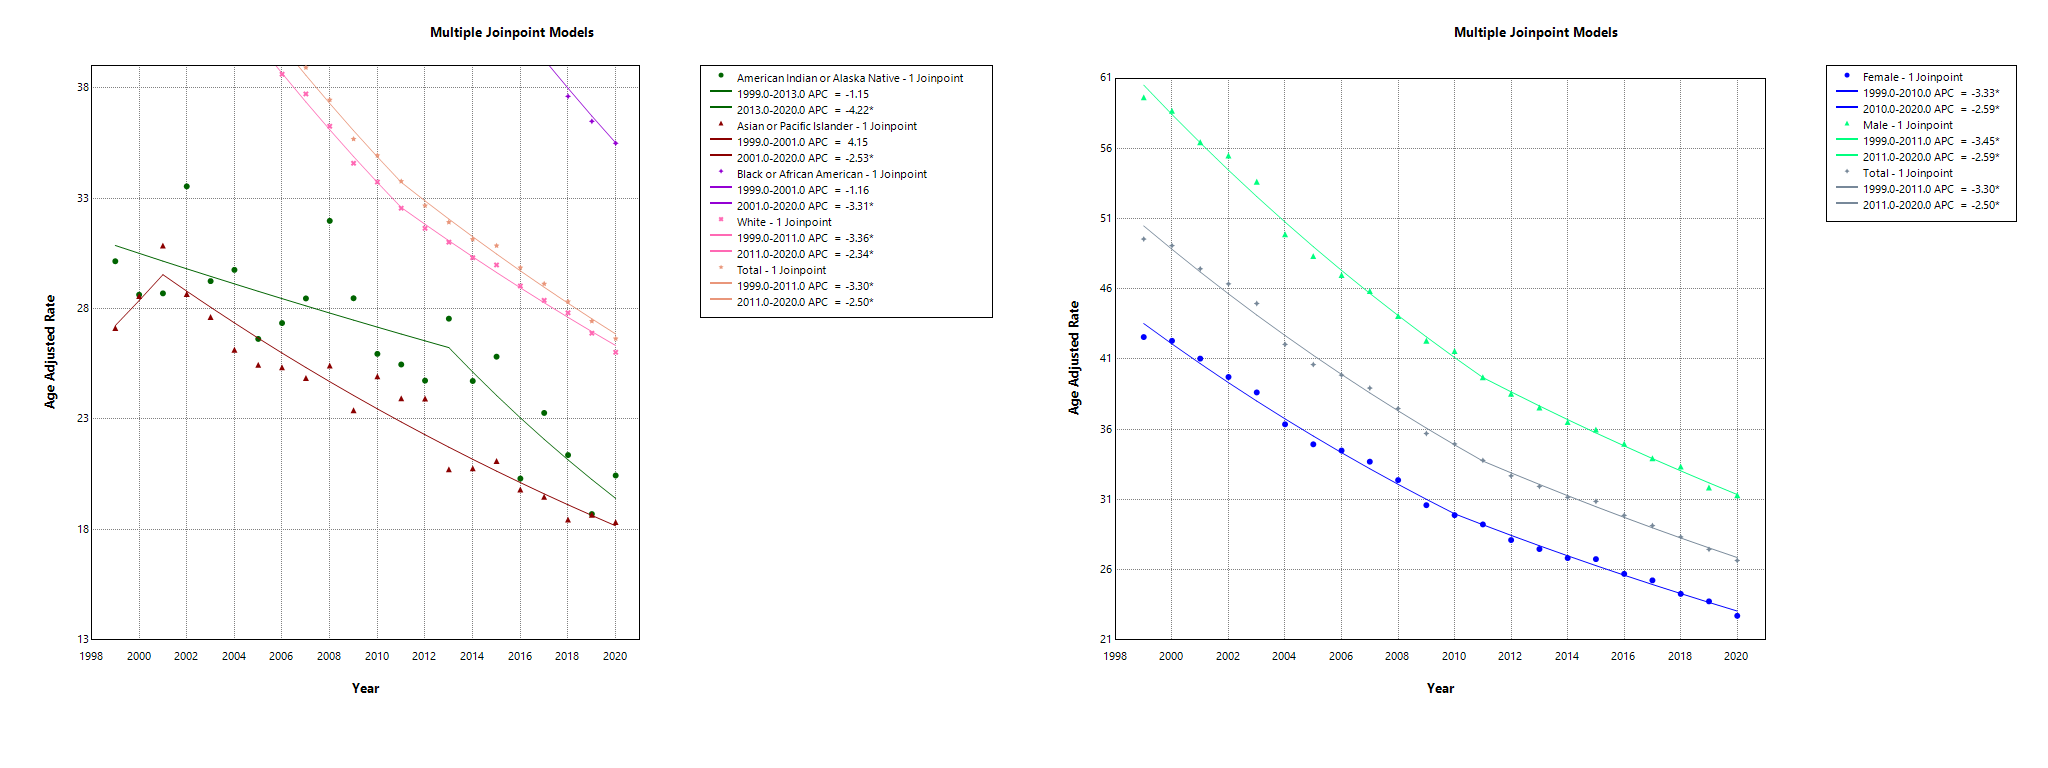
From 1999 to 2020, CRC AAMR fell from 49.54 to 26.65 (APC −3.30% in 1999–2011; −2.50% in 2011–2020; p < 0.000001), while CRC+IDA AAMR declined −3.07% annually in 1999–2015 (p = 0.0024) before rising +22.11% in 2015–2020 (p < 0.000001). Trends were analogous by sex: CRC in men (−3.45%, then −2.59%) and women (−3.33%, then −2.59%) and CRC+IDA in men (−7.36%, then +14.03%) and women (−3.21%, then +8.98%); all p ≤ 0.001 except the 1999–2012 female CRC+IDA decline (p = 0.03). Black decedents had the highest CRC (peak AAMR 68.81) and CRC+IDA (0.0803) rates; Asian/Pacific Islanders the lowest CRC rates (27.13→18.30); and Hispanics the lowest CRC+IDA rates (0.0480 vs 0.0569 in non‐Hispanics). State‐level CRC AAMRs ranged from 45.40 in Mississippi to 26.97 in Utah, and CRC+IDA from 0.1555 in Iowa to 0.0223 in Maryland. Crude mortality rates rose with age, peaking in those ≥ 85 years (CRC 171.46; CRC + IDA 0.72)—and most deaths occurred at home (41.5% CRC; 37% CRC + IDA) or in inpatient/nursing facilities (26.3%; 30%). AAMRs were highest in noncore areas (CRC 41.09; CRC + IDA 0.0892) and lowest in medium metros (CRC 34.09) and large central metros for CRC + IDA (0.0396). Race-specific CRC APCs were –3.36% (1999–2011) then –2.34% (2011–2020) for Whites; –1.16% (1999–2001) then –3.31% (2001–2020) for Blacks; +4.15% (through 2001) then –2.53% (2001–2020) for Asian/Pacific Islanders; and –1.15% (1999–2013) then –4.22% (2013–2020) for American Indian/Alaska Natives.